Analyse user behaviour & optimise the user workflow using a machine learning algorithm


Introduction
E‐commerce has resulted in organizations investing significant resources in online strategies to extend business processes on to the World Wide Web. Traditional methods of measuring Web usage fall short of the richness of data required for the effective evaluation of such strategies. Web analytics is an approach that may meet organizational demand for effective evaluation of online strategies.
“The more we know about how visitors are using content, and the more accurate that knowledge is, the better we can find out what sort of content works best for our target audience and adjust our strategy and posting schedules accordingly. Content may be king, but data is its queen.”- Jordan Louis
A website user is a person who is accessing, browsing or interacting with a website, and user behaviour refers to how people use a website. Behaviours include everything from the journey they take through the site to interactions such as clicks. When it comes to optimising a website, simply monitoring behaviour can only get you so far. The real value comes from analysing users’ actions to get to the bottom of what makes them behave as they do.
Behaviour is complex and varies across different websites depending on the target audience. This means you need to learn specifically about your users. Who are they? What are their needs? Which browsers and devices do they prefer? How often do they purchase? Answering these questions is crucial if you want to have a competitive edge, meet consumer needs and retain your customers. By researching online behaviours, you can get an idea of what users are trying to achieve, the factors driving certain behaviours, where they experience friction and areas where user experience can be better. Ultimately, learning how visitors behave on your website allows you to provide an enhanced experience that’s in line with user needs, which in turn will ensure your business continues to grow.
One of the main tools we use to carry out research is Google Analytics. This is free and fairly easy to set up. Once installed, you’ll have access to valuable data about how users behave on your site, including where they land and go next, where they drop off and what they interact with. You can also use it to discover overall trends and patterns and source opportunities for growth.
Web Application
E-commerce websites are online portals that facilitate online transactions of goods and services through means of the transfer of information and funds over the Internet. In the early days, e-Commerce was done partially through emails and phone calls. Now, with a single website, anything and everything that a transaction needs, can be executed online.
I have used the following steps to create my E-commerce website:
Firstly, I have taken the domain name (Kitaab.cloudaccess.host) and hosting from cloudaccess.net, which also provided me with access to WordPress.
Then, I use a pre-existent theme Astra from WordPress and edit the same to suit my requirements.
My website contains the following web pages:
a) Home- It is the homepage of my website.
b) Store- It contains various products categorized into different categories.
c) Account- It contains the account details of the user.
d) Contact Us- It contains the contact details of the company.
e) About- It contains team details.
The website contains various features:
a) View a list of products
b) View product details
c) Search products
d) Use filters to change the product list (eg. Category, price range, etc.)
e) Add a product to the cart.
f) Payment Gateway.
UserGuiding- I have applied the user guiding tool named WalkMe that will guide a new user through orderly steps on my website to use it in the most simple way to buy a product.
Analytics
User Behavior Analytics or UBA focuses on what the user is doing: apps launched, network activity, and, most critically files accessed (when the file or email was touched, who touched it, what was done with it and how frequently).
UBA technology searches for patterns of usage that indicate unusual or anomalous behaviour — regardless of whether the activities are coming from a hacker, insider, or even malware or other processes. While UBA won’t prevent hackers or insiders from getting into your system, it can quickly spot their work and minimize damage.
I have integrated my website to the analytics platform named Google Analytics. This tool is able to track the user’s action and the time spent by the users on the various actions of the website. I have accumulated the analytics data from various users and stored them. I have collected data of around 103 users with various data points such as:
Time spent by users on the different pages on the website,
Filters being used by the users,
Time spent by users on a particular product page, etc.

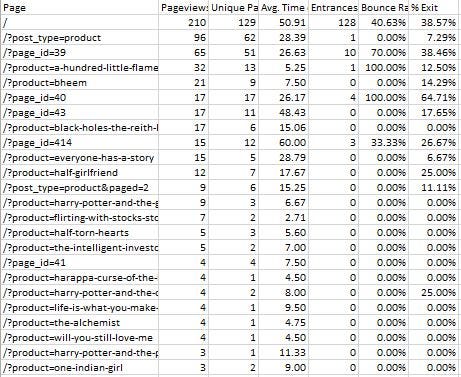
Example — Analytics All Website Data Pages
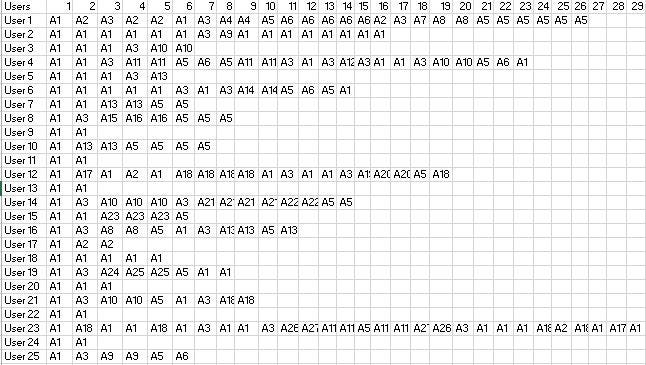
Example- Action Perform By Users
ML Model and Data Analysis
The elusive clickstream data. Many platforms, like Facebook, rely on these generated data from what a user clicks and what doesn’t. To start analyzing clickstream data, we need first to be able to capture step by step a user’s activity across a web page or application. And that is of great value in the hands of any Internet marketer. Getting a 360-degree view of a customer by knowing what he is clicking and what he is not can get you a huge improvement in both your products and your customers’ experience.
Data Collection
Either you have your data in your data warehouse, or you need to enrich it with more data sources you need to have a way to collect and store data consistently into a database.
Data Preparation
Raw data is like a rough diamond; It requires some refinement before being truly valuable.
In the data world, refinement includes data processing, cleaning, and transformation of the initial data into something convenient for the analysis you are going to carry out.
In this case, we would like to have our data grouped into users. It would be good too, we could arrange the events of each user in time order before moving to actual analysis.
In contrast to other data sequences, clickstream data can have a varying length for every different user.
In order to transform the initially collected event log into clickstream data we need to:
Identify events/actions performed by the same user and group them together
Split them further into subgroups of events based on which of those were performed during the same session according to the session’s definition given above.
At this point the dataset we are going to use for the rest of the analysis should look like this:
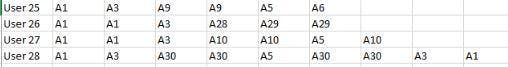
In this representation, each line corresponds to a user. The first field is the user’s name while the next fields the actions performed by the user during this session.
Model Construction
Markov Chains
The type of data Markov Chains work with are sequential data.
Markov process is a stochastic process that satisfies the Markov Property of memorylessness. A Markov chain is, in fact, a Markov process too in either discrete or continuous time with a countable state space.
In clickstream analysis, we usually utilize these Markov Chains. The process takes the state from a finite set at each time. The order of a Markov Chain is derived from the number of recent states on which the current state, we assume, depends. Based on this, zero-order chains imply that the probability of being in a state in the next step is independent of all previous states.
Higher-order Markov Chain introduced by Raftery (1985) will lead to more realistic models. At the same time, the parameters needed for the representation increase exponentially and so it is important to find the right balance between these two.
Fitting a Markov Chain
As mentioned before at this point our dataset looks like this:
Fitting the Markov Chain model gives us the transition probabilities matrices and the lambda parameters of the chain for each one of the three lags along with the Start and End Probabilities.
Start and End probabilities correspond to the probability that a clickstream will start or end with this specific event.
The transition probability matrix can be represented as a heat map with the y-axis representing the current state and the x-axis the next one. The more bullish the colour, the more probable the indicated transition will occur.
from markovclick.models import MarkovClickstream
m = MarkovClickstream(data)
fig=plt.figure(figsize=(18, 16), dpi= 80, facecolor='w', edgecolor='k')
sns.heatmap(m.prob_matrix, xticklabels=m.pages, yticklabels=m.pages,cmap="YlGnBu")
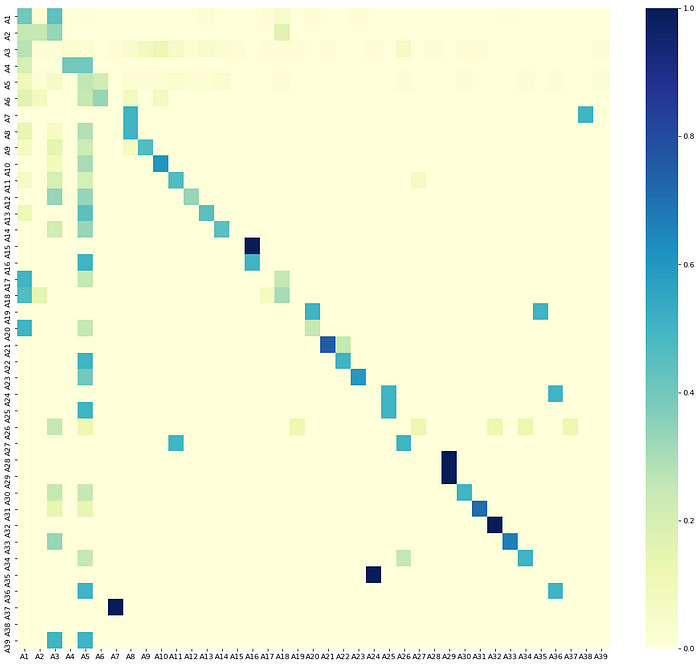
Heat Map
from markovclick.viz import visualise_markov_chain
graph = visualise_markov_chain(m)
graph
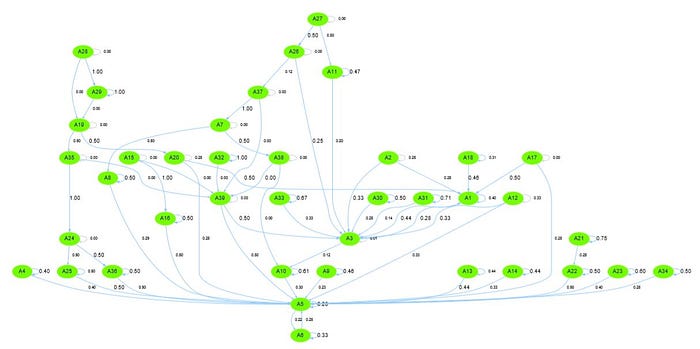
Transaction diagram
<how about adding a summary or a conclusion here?>